KCP Support & Resistance [Dr.K.C.PRAKASH]ChatGPT said:
This indicator “KCP Support & Resistance ” (Pine Script v5) is a multi-featured support & resistance tool that combines pivots, slope-based channels, Fibonacci options, and SMA200 trend reference.
🔎 Core Concept
The script identifies pivot highs and lows and uses them to draw support and resistance levels on the chart.
It allows you to visualize them in two ways:
Horizontal lines (flat support/resistance at pivot values).
Parallel slope-based lines (trend-adjusted, drawn with slope factor).
⚙️ Settings & Options
Theme
useDark: Switches to a dark-color palette with bright neon-style lines for better visibility on dark charts.
Basic Settings
length: Pivot length (bars used to detect swing high/low).
lookback: How many past pivot points to use for plotting lines.
Slope: Multiplier applied to slope calculations (for slanted trendline-style S/R).
Extend Horizontal Lines Left?: Option to extend horizontal lines to both sides.
Extend Parallel Lines Left?: Same for slope-based lines.
Show/Hide Controls
Show Parallel Lines?: Toggle diagonal support/resistance.
Show Horizontal Lines?: Toggle flat levels.
Show SMA 200 Line?: Toggle long-term SMA(200) reference.
Hide Fibonacci Lines? / Show Fib Trend Line? / Show All Fibonacci Lines?: (reserved for Fib functionality).
Line Colors
Customizable line colors for parallel & horizontal high/low lines.
If Dark Theme is enabled → Uses preset colors:
Electric Blue (Resistance - Parallel Highs)
Neon Green (Support - Parallel Lows)
Deep Red/Pink (Horizontal Highs)
Warm Yellow (Horizontal Lows)
📐 Logic & Calculations
Pivot Detection
Uses ta.pivothigh & ta.pivotlow with length to mark swing points.
Stores them in arrays for drawing multiple levels.
Slope Calculation
Uses covariance/variance of price vs. time (bar_index) to estimate slope.
Multiplied by Slope factor.
Makes trend-following parallel support/resistance lines possible.
Line Drawing
Parallel lines: Slanted, based on pivot highs/lows + slope.
Horizontal lines: Flat support & resistance levels extended across the chart.
SMA200 Plot
Plots SMA(200) for long-term trend direction.
Colored white if EMA(200) > SMA(200), else yellow (trend bias visual).
📊 What You See on Chart
Support & Resistance drawn dynamically from pivots.
Choice of horizontal (classic S/R) or sloped (trend-following) lines.
Dark theme colors → Electric blue, neon green, deep pink, warm yellow (if enabled).
SMA200 reference line → Helps identify bullish/bearish long-term bias.
Optional Fibonacci lines (future expansion).
Cerca negli script per "swing high low"

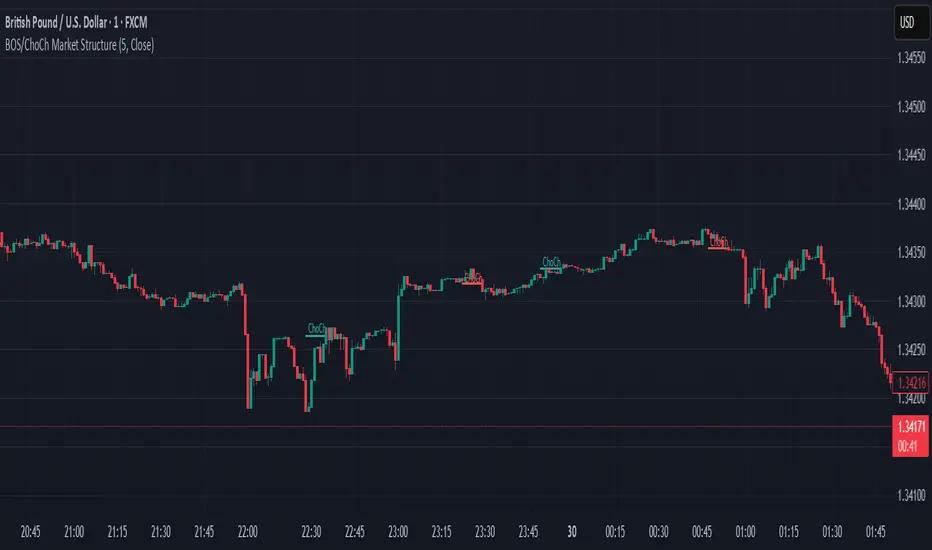
BOS & ChoCh Market StructureBOS/ChoCh Market Structure Indicator
This indicator identifies key market structure shifts using Break of Structure (BOS) and Change of Character (ChoCh) signals based on pivot point analysis.
Concept
Break of Structure (BOS) occurs when price breaks through a significant pivot level in the direction of the current trend, signaling trend continuation. A bullish BOS happens when price breaks above a pivot high while in an uptrend, while a bearish BOS occurs when price breaks below a pivot low during a downtrend.
Change of Character (ChoCh) signals a potential trend reversal. It occurs when price breaks against the prevailing trend - breaking above a pivot high while in a downtrend, or breaking below a pivot low while in an uptrend. This indicates the market structure is shifting.
How It Works
The indicator automatically detects swing highs and lows using configurable pivot strength. When price breaks these levels, it plots:
Color-coded labels (cyan for bullish breaks, red for bearish breaks)
Small horizontal lines marking the exact breakout level
Extended lines from pivot points showing key support/resistance levels
Settings
Pivot Strength - Number of candles on each side required to confirm a swing high/low (default: 5). Higher values identify more significant pivots but produce fewer signals.
Breakout Confirmation - Choose whether breakouts require a candle close beyond the level ("Close") or just a wick touch ("Wick").
Show BOS / Show ChoCh - Toggle visibility of Break of Structure and Change of Character signals independently.
Colors - Customize the colors for bullish (cyan) and bearish (red) signals.
Perfect for swing traders and market structure analysis.
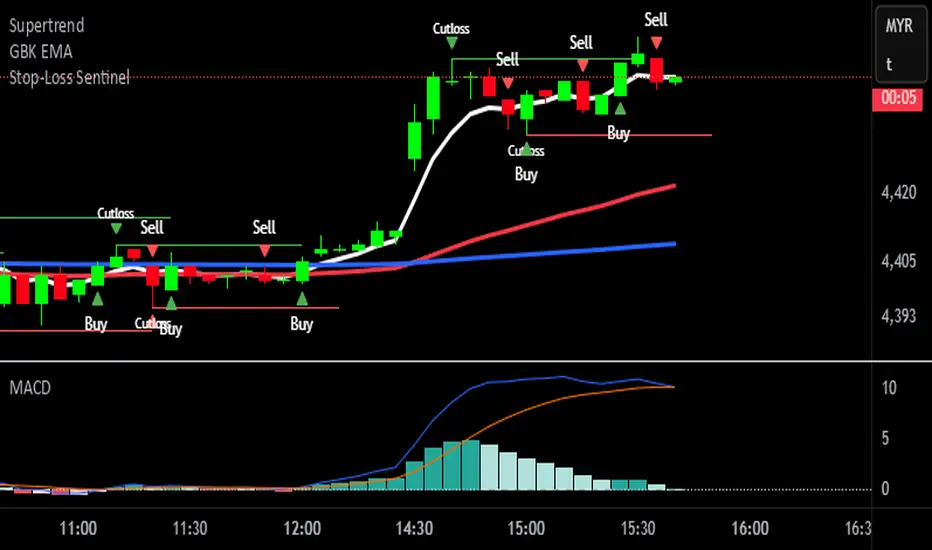
Stop-Loss Sentinel
Cutloss Swing Marker with Adjustable Trend Lines
This indicator identifies swing highs and lows using pivot points.
Swing Highs are marked with a green downward triangle and a "Cutloss" label above the bar.
Swing Lows are marked with a red upward triangle and a "Cutloss" label below the bar.
From each Cutloss point, a horizontal trend line is drawn forward for a set number of bars.
All colors (text, trend lines) and line length are fully adjustable in the settings.
Intended Use:
Helps traders visually mark potential stop-loss or reversal zones and track them over the next few bars. Works on any timeframe, but is designed for fast decision-making on lower timeframes like M1.
Marks key swing highs/lows with ‘Cutloss’ labels and triangles, then extends customizable trend lines for the next bars. Ideal for spotting stop-loss or reversal zones on any timeframe.
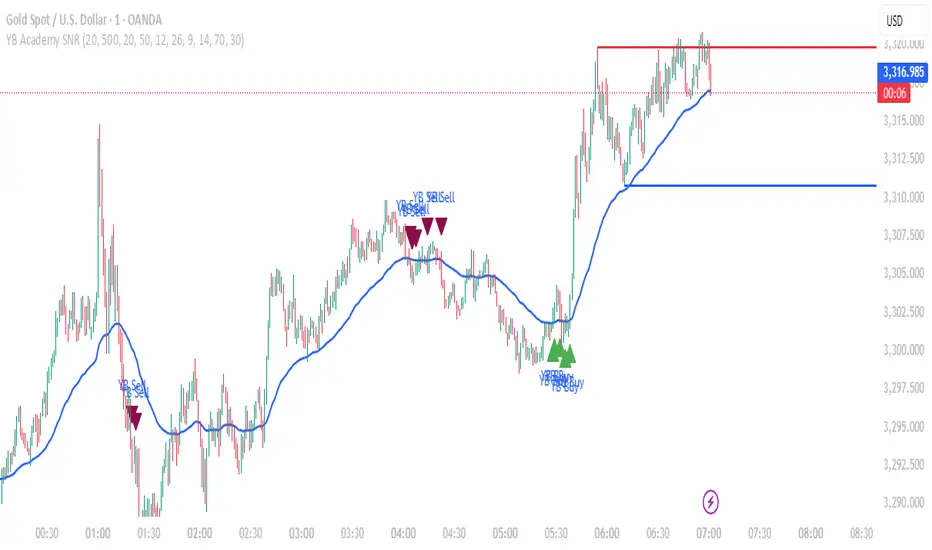
YB Academy SNRThe YB Academy SNR indicator is a complete swing-based Support & Resistance mapping tool with powerful built-in entry/exit signals. Designed for traders who want to identify high-probability reaction zones and get real-time alerts for the best buy and sell opportunities, this script helps you trade with structure, confidence, and discipline—on any time frame.
How It Works
1. Automatic Support & Resistance Detection
The indicator automatically scans for major swing highs and swing lows on your chart using a sensitivity parameter.
Every time a new swing high/low forms, a horizontal SNR line is drawn at that price level.
Both support and resistance lines automatically extend to the right of your chart, providing a persistent map of key levels for future entries and exits.
You can control how many recent zones are shown (max_snrs), keeping your chart clean and focused.
2. Smart Buy/Sell Signal Generation
Buy signals (“YB Buy”): Trigger when price touches or bounces off a support line, with trend/momentum/freshness filters:
Price is above the EMA50 (trend filter)
MACD is bullish (momentum)
RSI confirms no overbought
Sell signals (“YB Sell”): Trigger when price hits resistance, with strict confirmation:
Price is below EMA50
MACD is bearish
RSI not oversold
Both signals are shown as clear up/down triangle arrows directly on your chart.
3. Powerful Alerts
Never miss a trade: Real-time alerts fire as soon as a valid buy or sell condition appears.
Use with TradingView app, web, or SMS for 24/7 notification—no chart-watching needed.
4. Fully Customizable
Change sensitivity for tighter/looser SNR mapping.
Control the look and feel: colors for SNR, signals, number of zones, extension distance.
Works on any market: gold, forex, indices, crypto, stocks.
5. Clean Visuals, Zero Clutter
SNR lines are automatically managed—older zones are removed as new ones appear.
Only the latest/best buy/sell signals are shown, so you can act quickly and decisively.
Perfect For:
Scalpers, Day Traders, Swing Traders
Anyone who wants to trade using clean price action levels, NOT lagging indicators
Traders looking for rule-based, mechanical entries and exits
What Makes This Unique?
Precision: Uses swing structure, not arbitrary pivots or moving averages, for SNR.
Multi-Filter Entries: Combines trend, momentum, and overbought/oversold logic for high-probability signals.
Alerts & Automation: Built-in, with no need for manual chart watching.
Simple to Use: Add to any TradingView chart, adjust settings, and go.
Upgrade your trading with the YB Academy SNR!
Get alerted to the real opportunities—right at the key price zones, with all the discipline of a professional.
Scalper's Fractal Cloud with RSI + VWAP + MACD (Fixed)Scalper’s Fractal Confluence Dashboard
1. Purpose of the Indicator
This TradingView indicator script provides a high-confluence setup for scalping and day trading. It blends momentum indicators (RSI, MACD), trend bias tools (EMA Cloud, VWAP), and structure (fractal swings, gap zones) to help confirm precise entries and exits.
2. Components of the Indicator
- EMA Cloud (50 & 200 EMA): Trend bias – green means bullish, red means bearish. Avoid longs under red cloud.
- VWAP: Institutional volume anchor. Ideal entries are pullbacks to VWAP in direction of trend.
- Gap Zones: Shows open-air zones (white space) where price can move fast. Used to anticipate momentum moves.
- ZigZag Swings: Marks structural pivots (highs/lows) – useful for stop placement and range anticipation.
- MACD Histogram: Shows bullish or bearish momentum via background color.
- RSI: Overbought (>70) or oversold (<30) warnings. Good for exits or countertrend reversion plays.
- EMA Spread Label: Quick view of momentum strength. Wide spread = strong trend.
3. Scalping Entry Checklist
Before entering a trade, confirm these conditions:
• • Bias: EMA cloud color supports trade direction
• • Price is above/below VWAP (confirming institutional flow)
• • MACD histogram matches direction (green for long, red for short)
• • RSI not at extreme (unless you’re fading trend)
• • If entering gap zone, expect fast move
• • Recent swing high/low nearby for target or stop
4. Risk & Sizing Guidelines
Risk 1–2% of account per trade. Place stop below recent swing low (for longs) or high (for shorts). Use fractional sizing near VWAP or white space zones for scalping reversals.
5. Daily Trade Journal Template
- Date:
- Ticker:
- Setup Type (VWAP pullback, Gap Break, EMA reversion):
- Entry Time:
- Bias (Green/Red Cloud):
- RSI Level / MACD Reading:
- Stop Loss:
- Target:
- Result (P/L):
- What I Did Well:
- What Needs Work:

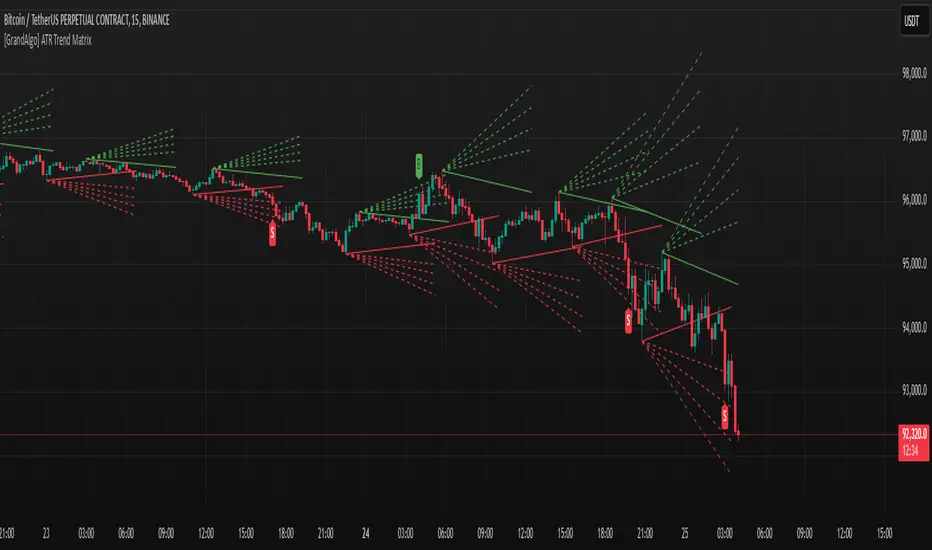
[GrandAlgo] ATR Trend MatrixThe ATR Trend Matrix is a dynamic trendline indicator designed to help traders visualize market structure using ATR-based trend projections. This tool adapts to price action and highlights potential support and resistance zones based on Average True Range (ATR) calculations.
Key Features
ATR-Based Trendlines – Calculates and plots dynamic trendlines using an adjustable ATR factor.
Multi-Level Matrix System – Provides up to four matrix levels, each customizable with different ATR multipliers.
Swing High & Low Detection – Automatically detects market pivots to serve as anchor points for trendlines.
Adjustable Trend Length – Fine-tune the sensitivity of trendlines using the Swing Length and Trend-Line Length Multiplier.
Auto-Adjustment Mode – When enabled, trendlines update dynamically as ATR evolves.
Buy & Sell Signals – Marks potential trade setups when price crosses below or above Matrix Level 1.
How It Works
Detects Swing Points – Identifies key highs and lows in the market using the length setting.
Plots ATR-Based Trendlines – Calculates trendlines using ATR with user-defined multipliers for four matrix levels.
Adjusts Dynamically – If Auto Adjust is enabled, trendlines shift with ATR movements.
Identifies Trade Signals – Highlights potential buy/sell zones when price interacts with Matrix Level 1 trendlines.
Manages Active Trendlines – Automatically updates and removes trendlines based on price interaction.
User Settings
General Settings
ATR Factor – Controls the ATR multiplier for trendline calculation.
Swing Length – Defines the number of bars for swing high/low detection.
Trend-Line Length Multiplier – Adjusts the extension length of trendlines.
Auto Adjust Trendlines – Enables real-time adjustment of trendlines as ATR changes.
Matrix Settings
Matrix Level 1-4 – Enable or disable individual trendline levels.
Matrix Factors – Customize the ATR multipliers for each matrix level.
Trading Applications
Trend Confirmation – Use the primary trendline and matrix levels to gauge trend strength.
Support & Resistance Zones – ATR-based trendlines can act as dynamic support/resistance.
Breakout & Rejection Signals – Identify potential breakouts or reversals when price interacts with matrix levels.
Volatility-Based Trading – ATR helps adjust trendlines based on market volatility.
The ATR Trend Matrix is a powerful tool for traders who want a dynamic, adaptive trendline system that reacts to market structure and volatility. With customizable settings, multi-level ATR projections, and trade signal detection, this indicator provides a comprehensive approach to price action analysis.
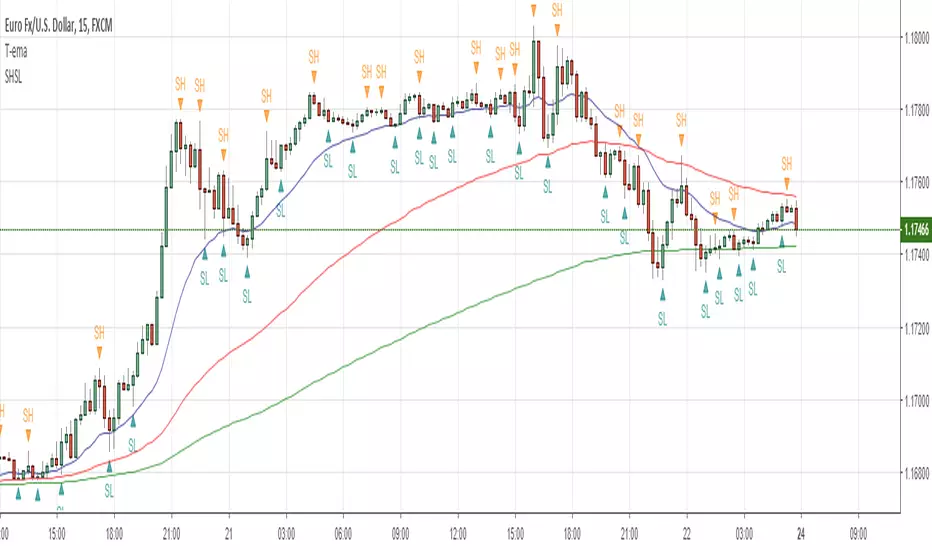
Swing Highs and LowsSimple script to overlay swing highs and lows.
A Swing High (SH): a price bar high preceded by two lower highs (LH) and followed by two lower highs (LH).
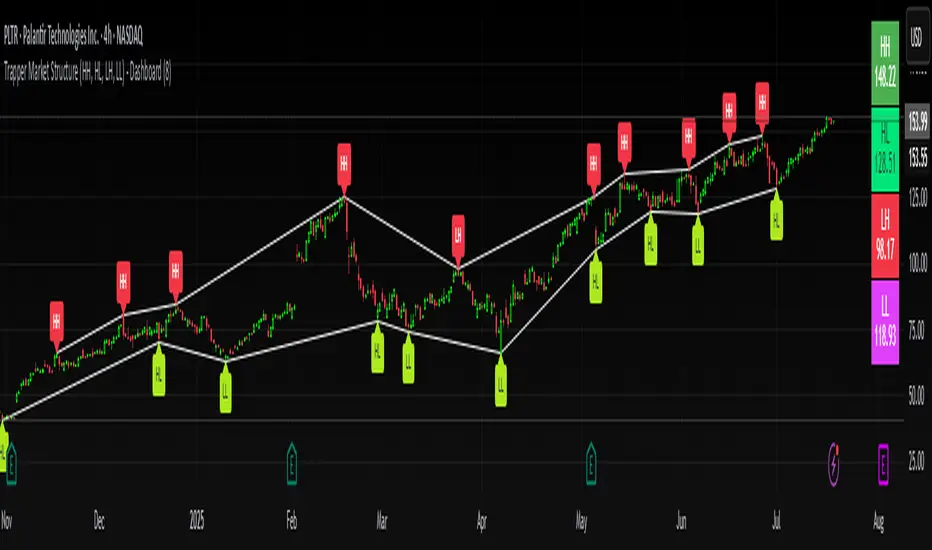
Trapper Market Structure (HH, HL, LH, LL)This script is designed to visually identify price action market structure in real time using pivot-based logic. It highlights the key components of trend direction by labeling:
- **HH** – Higher Highs
- **HL** – Higher Lows
- **LH** – Lower Highs
- **LL** – Lower Lows
These labels help traders track evolving market conditions and spot trend continuations, breaks in structure, or potential reversals — all without guessing.
**How It Works**
The script detects local swing highs and lows based on a customizable pivot strength. Once a valid pivot is confirmed, it’s classified in context with the previous relevant pivot to determine its structural significance.
For example:
- If a pivot high is higher than the previous, it’s marked as a **HH**.
- If a pivot low is lower than the previous, it’s marked as a **LL**, and so on.
This running analysis helps traders anticipate shifts between bullish and bearish structures.
**Customizable Features**
- Adjust **Pivot Strength** to increase or reduce sensitivity (more reactive or more stable)
- Toggle **Labels** on/off for cleaner charts
- Toggle **Connecting Lines** between pivots to visualize structure flow
**Use Case**
This indicator is ideal for:
- Price action traders
- Market structure analysis
- Identifying entry zones during pullbacks (e.g., buying at HLs during uptrends)
- Confirming trend reversals or break-of-structure (BoS)
You can use this tool as a foundation for more advanced systems such as CHoCH/BOS detection, liquidity zones, or sniper-style entry frameworks.
**Concepts Used**
- Swing High/Low detection using `ta.pivothigh` and `ta.pivotlow`
- Market structure labeling logic
- Visual flow to reinforce trader psychology on trend states
Disclaimer
This script is provided for educational purposes only. It is not financial advice and should not be relied upon for trading decisions. Always conduct your own analysis and risk management.
#marketstructure #priceaction #technicalanalysis #tradingviewopen #pivotpoints
Liqudation HeatMap [BigBeluga]🔵 OVERVIEW
An advanced liquidity visualization tool that plots horizontal heat zones to highlight where potential liquidations and volume clusters are most likely hiding beneath price action.
Liqudation HeatMap scans historical price movements for local highs and lows with elevated volume or candle range. It then draws dynamic heatmap boxes—shaded from lime (low interest) to yellow (high interest)—revealing potential zones of trapped positions or stop clusters. A vertical scale on the right shows you the relative strength of volume behind each level, from 0 to the highest detected.
🔵 CONCEPTS
Maps areas of potential liquidity using volume or candle range (if volume is unavailable).
Identifies swing highs/lows (pivots) and extends heatmap boxes outward from these levels. Colors each zone based on the relative strength of volume concentration.
Fades or removes zones once price crosses their midpoints, simulating the idea of liquidity being “consumed.”
Displays a live vertical scale that shows the volume range for quick reference.
🔵 FEATURES
Dynamic Heatmap Zones:
Draws few boxes above and after pivot highs and below pivot lows, each shaded based on volume concentration.
Smart Coloring System:
Uses a gradient from lime (low) to yellow (high) to visually distinguish between weak and strong liquidity zones.
Adaptive ATR Widths:
Automatically adjusts zone thickness based on volatility (ATR), scaling intelligently across timeframes.
Liquidity Consumption Logic:
Zones are stope extending once price interacts with them—mimicking the behavior of real liquidation sweeps.
Volume Scale Legend:
A real-time scale is plotted on the right side, showing the min-max range of volume used for heat calculations.
🔵 HOW TO USE
Look for thick yellow zones to identify areas of concentrated stop losses or liquidation triggers.
Use these levels to anticipate mean reversion points or high-volatility zones.
Combine with your trend or structure tools to trade into or fade these liquidity pools.
On lower timeframes, use this tool to confirm entries around sweeps or deviations.
Use the right-side scale to compare relative zone strength instantly.
🔵 CONCLUSION
Liqudation HeatMap is a powerful visualization tool that uncovers where liquidity likely resides on the chart. By highlighting hidden traps and reactive levels in real-time, it gives traders a significant edge when it comes to spotting stop hunts, mean reversions, and areas of institutional interest. Whether you’re scalping or swing trading, this heatmap provides unmatched context on the market’s hidden intent.

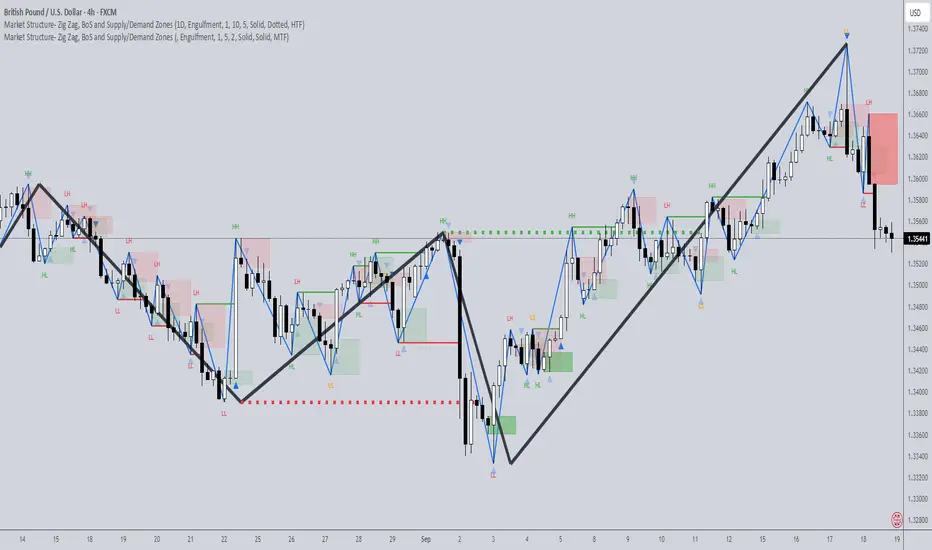
Market Structure- ZigZag, Break of Structure & Order BlocksDescription:
This script is an all-in-one market structure tool designed for traders who follow price action, Smart Money Concepts (SMC), or institutional order flow. It combines Order Block detection , Break of Structure (BOS) , Internal Structure Shifts (CHoCH) , and a ZigZag swing framework to provide a clear and actionable view of market behavior.
Key Features:
Order Blocks (OB) :
-Detects Bullish (Green) and Bearish (Red) order blocks upon valid market structure shifts.
-Optional deletion of mitigated (touched) blocks to keep charts clean.
-Customizable block duration, fill color, and border color.
Break of Structure (BOS) :
-Marks BOS with horizontal dotted lines when price breaks previous swing highs/lows.
-Confirms new trends and structural shifts.
Internal Structure Shifts (CHoCH-like) :
-Detects early internal changes in direction before BOS.
-User-selectable logic: based on candle Open or High/Low.
-Plotted as small black triangle markers.
ZigZag Swings :
-Connects confirmed internal shifts with black zigzag lines.
-Visually simplifies trend structure and major swing points.
-Tracks last swing highs/lows for BOS validation.
Alerts :
-Bullish/Bearish Engulfments (OB signals)
-Internal Structure Shifts
-Bullish/Bearish Break of Structure
-OB Mitigation Events
Inputs & Settings :
-Show/Hide Bullish or Bearish Order Blocks
-Calculate internal shifts by: Open or High/Low
-Set order block fill and border colors
-Enable or disable automatic deletion of mitigated blocks
-Set duration for order block display
This tool is designed to support price action trading by visually mapping key structural changes and zones of interest directly on your chart. It is not intended to function as a standalone trading strategy , but rather as a supplementary tool to inform your own analysis and discretion.
Fibonacci Ranges (Real-Time) [LuxAlgo]The "Fibonacci Ranges" indicator combines Fibonacci ratio-derived ranges (channels), together with a Fibonacci pattern of the latest swing high/low.
🔶 USAGE
The indicator draws real-time ranges based on Fibonacci ratios as well as retracements. Breakouts from a Fibonacci Channel are also indicated by labels, indicating a potential reversal.
Each range extremity/area can also be used as support/resistance.
🔶 CONCEPTS
Fibonacci Channels
Latest Fibonacci
Both, Latest Fibonacci and Fibonacci Channels , display different Fibonacci levels (labels not included in the code):
However, the 2 react in a totally different way.
🔹 Fibonacci Channels
2 conditions must be fulfilled until a Fibonacci Channel is displayed:
New swing high/low
close has to be between chosen limits/levels ( Break level )
As visual guidance, chosen Break levels are accentuated by 2 small gray blocks:
Once the channel is displayed, it will remain visible until x consecutive bars break out of the chosen Break level at closing time.
• x consecutive bars is set by Break count .
The amount of breaks is counted in the code. When the price, without breaking the user-set limit, closes back between the 2 levels, the count is reset to 0.
By enabling Channels and Shadows you can see previous channels (" Shadows ", which is always delayed with 1 bar)
Previous channels can be helpful in finding potential support/resistance areas, especially from large channel blocks
The more narrow Break levels are set the less chance the price closes between these 2 levels, and the quicker close breaks out.
In other words, narrow levels give fewer & smaller channels, broader levels give more & larger channels.
Note:
• swing settings: L & R
• Break count (x consecutive bars that close outside chosen levels to invalidate the Fibonacci Channel )
will also be of influence in displaying the channels.
• Show breaks enable you to visualize signals when there is a break:
• Alerts can also be set ( Break Down / Break Up )
🔹 Latest Fibonacci
This displays the Fibonacci levels between the latest swing high and swing low, independently from the Fibonacci Channel .
The Lastest Fibonacci can be helpful in detecting the current trend against the larger Fibonacci Channel .
🔶 SETTINGS
🔹 Swing Settings
L: set left of pivothigh / pivotlow
R: set right of pivothigh / pivotlow
🔹 Fibonacci Channels
Channel : Channel / Channels + Shadows / None
Break level
-0.382 - 1.382
0.000 - 1.000
0.236 - 0.764
0.382 - 0.618
Break count
🔹 Fibonacci
Toggle
Colours: [ -0.382 - 0 ], [ 0.236 - 0.382 ], [ 0.5 ], [ 0.618 - 0.764 ], [ 1 - 1.382 ]

Order-Flow Market StructureOrder-Flow Market Structure by The_Forex_Steward
A precision tool for visualizing internal shifts, swing structure, BOS events, Fibonacci levels, and multi-timeframe alerts.
What It Does
The Order-Flow Market Structure indicator intelligently tracks and visualizes price structure using higher timeframe candles. It automatically detects:
• Internal bullish and bearish structure shifts
• Swing highs and lows (HH, HL, LH, LL)
• Break of Structure (BoS) confirmations
• Fibonacci retracement levels from recent swing moves
• Real-time alerts across LTF, MTF, and HTF modes
It’s a complete tool for traders who follow Smart Money Concepts, ICT, or institutional price action strategies.
How It Works
• You select a Higher Timeframe (HTF) to set the structural context
• Internal shifts are identified using HTF candle closes
• The indicator scans for swing highs/lows after each internal shift
• Breaks of previous swing points confirm BoS and plot horizontal lines
• Zigzag lines visually connect structural points (swings and BoS)
• Fibonacci levels are drawn between the latest swings
• Alerts can be configured for structure shifts, BoS events, and fib level breaks
How to Use It
Set your preferred HTF (e.g., 1H while trading on 5-minute)
Enable Fibonacci levels to visualize retracement zones
Watch for:
• Bullish internal shifts → HL to HH
• Bearish internal shifts → LH to LL
• BOS → Breakout confirmation
Enable alerts to catch structural events in real-time
Adjust the "Safe History Offset" if working with long lookbacks or volatile assets
Who It's For
• Traders using Smart Money, ICT, or market structure-based systems
• Scalpers, day traders, and swing traders
• Anyone needing precise structural insight across multiple timeframes
Features
• BoS detection with custom line styles and width
• HH, HL, LH, LL label plotting
• Optional Fibonacci retracement zones
• Custom alerts for swing shifts and fib level breaks
• LTF, MTF, and HTF alert modes
Stay aligned with structure, trade with precision, and get alerted to key shifts in real time.

Rawstocks 15 Minute ModelRawstocks 15-Minute Model
The Rawstocks 15-Minute Model is a precision intraday trading strategy designed for the US stock market (9:30 AM - 4:00 PM ET), optimized for the 15-minute timeframe. It combines institutional order flow concepts with Fibonacci retracements to identify high-probability reversal setups while enforcing strict risk management and session-based rules.
Key Features
Time-Based Execution
Trading Hours: 9:30 AM - 4:00 PM ET (no new entries after 4:00 PM)
Force Close: All positions auto-exit at 4:30 PM ET (prevents overnight risk)
Entry Logic
Order Block + Fib Confluence:
Identifies institutional order blocks (previous swing highs/lows)
Requires price pullback to 61.8% or 79% Fibonacci level
Liquidity Confirmation:
Waits for stop runs (liquidity sweeps) before reversal entries
Exit Rules
Stop Loss: 1x ATR (14) from entry
Take Profit: 2:1 Risk-Reward (adjustable)
Visual Signals
Green Triangle: Valid long setup (pullback to bullish OB + Fib)
Red Triangle: Valid short setup (pullback to bearish OB + Fib)
Blue/Purple Background: Highlights active trading vs. close period
How It Works
Identify the Setup
Wait for a strong impulse move (break of structure)
Mark the order block (institutional zone)
Confirm Pullback
Price must retrace to 61.8% or 79% Fib level
Must occur within trading hours (9:30 AM - 4:00 PM)
Enter on Confirmation
Long: Break of pullback candle high (stop below recent swing low)
Short: Break of pullback candle low (stop above recent swing high)
Manage the Trade
Trail stop or exit at 2R (risk-to-reward)
All positions close at 4:30 PM sharp

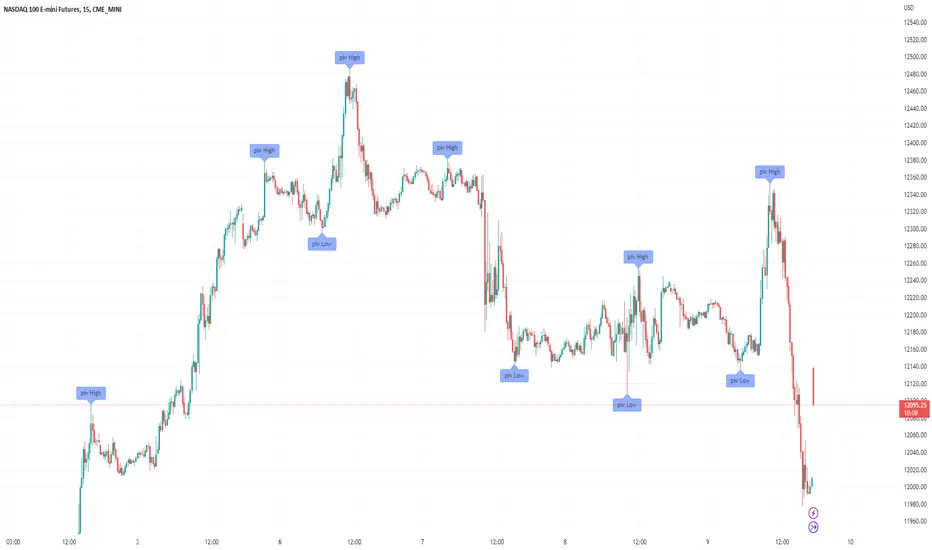
Swing Structure + Session Sweeps“Scalper-Friendly Trend & Sweep Detector”
Swing Structure + Session Sweeps with TEMA Cloud
This powerful all-in-one tool is designed for intraday traders, swing traders, and scalpers who want to spot high-probability reversals, trend continuations, and liquidity sweeps with confluence.
🔹 Core Features
Multi-layered TEMA Cloud (9, 20, 34, 50) for clear trend structure
Dynamic Bull/Bear labels when the trend flips
Centerline for TEMA 20 to visualize core trend direction
Session-based liquidity sweep detection (Asia, London, NY)
Volume and absorption dots to catch hidden pressure
Swing high/low detection (external and internal)
Visual VWAP, daily highs/lows, and customizable session zones
Optional alerts for volume spikes, absorption, and reversal sweeps
📈 Use it to:
Confirm directional bias
Anticipate pullbacks and breakouts
Identify volume-backed reversals
Align trades with session strength and swing confluence
⚙️ Built for scalpers, intraday opportunists, and precision chartists alike.

300-Candle Weighted Average Zones w/50 EMA SignalsThis indicator is designed to deliver a more nuanced view of price dynamics by combining a custom, weighted price average with a volatility-based zone and a trend filter (in this case, a 50-period exponential moving average). The core concept revolves around capturing the overall price level over a relatively large lookback window (300 candles) but with an intentional bias toward recent market activity (the most recent 20 candles), thereby offering a balance between long-term context and short-term responsiveness. By smoothing this weighted average and establishing a “zone” of standard deviation bands around it, the indicator provides a refined visualization of both average price and its recent volatility envelope. Traders can then look for confluence with a standard trend filter, such as the 50 EMA, to identify meaningful crossover signals that may represent trend shifts or opportunities for entry and exit.
What the Indicator Does:
Weighted Price Average:
Instead of using a simple or exponential moving average, this indicator calculates a custom weighted average price over the past 300 candles. Most historical candles receive a base weight of 1.0, but the most recent 20 candles are assigned a higher weight (for example, a weight of 2.0). This weighting scheme ensures that the calculation is not simply a static lookback average; it actively emphasizes current market conditions. The effect is to generate an average line that is more sensitive to the most recent price swings while still maintaining the historical context of the previous 280 candles.
Smoothing of the Weighted Average:
Once the raw weighted average is computed, an exponential smoothing function (EMA) is applied to reduce noise and produce a cleaner, more stable average line. This smoothing helps traders avoid reacting prematurely to minor price fluctuations. By stabilizing the average line, traders can more confidently identify actual shifts in market direction.
Volatility Zone via Standard Deviation Bands:
To contextualize how far price can deviate from this weighted average, the indicator uses standard deviation. Standard deviation is a statistical measure of volatility—how spread out the price values are around the mean. By adding and subtracting one standard deviation from the smoothed weighted average, the indicator plots an upper band and a lower band, creating a zone or channel. The area between these bands is filled, often with a semi-transparent color, highlighting a volatility corridor within which price and the EMA might oscillate.
This zone is invaluable in visualizing “normal” price behavior. When the 50 EMA line and the weighted average line are both within this volatility zone, it indicates that the market’s short- to mid-term trend and its average pricing are aligned well within typical volatility bounds.
Incorporation of a 50-Period EMA:
The inclusion of a commonly used trend filter, the 50 EMA, adds another layer of context to the analysis. The 50 EMA, being a widely recognized moving average length, is often considered a baseline for intermediate trend bias. It reacts faster than a long-term average (like a 200 EMA) but is still stable enough to filter out the market “chop” seen in very short-term averages.
By overlaying the 50 EMA on this custom weighted average and the surrounding volatility zone, the trader gains a dual-dimensional perspective:
Trend Direction: If the 50 EMA is generally above the weighted average, the short-term trend is gaining bullish momentum; if it’s below, the short-term trend has a bearish tilt.
Volatility Normalization: The bands, constructed from standard deviations, provide a sense of whether the price and the 50 EMA are operating within a statistically “normal” range. If the EMA crosses the weighted average within this zone, it signals a potential trend initiation or meaningful shift, as opposed to a random price spike outside normal volatility boundaries.
Why a Trader Would Want to Use This Indicator:
Contextualized Price Level:
Standard MAs may not fully incorporate the most recent price dynamics in a large lookback window. By weighting the most recent candles more heavily, this indicator ensures that the trader is always anchored to what the market is currently doing, not just what it did 100 or 200 candles ago.
Reduced Whipsaw with Smoothing:
The smoothed weighted average line reduces noise, helping traders filter out inconsequential price movements. This makes it easier to spot genuine changes in trend or sentiment.
Visual Volatility Gauge:
The standard deviation bands create a visual representation of “normal” price movement. Traders can quickly assess if a breakout or breakdown is statistically significant or just another oscillation within the expected volatility range.
Clear Trade Signals with Confirmation:
By integrating the 50 EMA and designing signals that trigger only when the 50 EMA crosses above or below the weighted average while inside the zone, the indicator provides a refined entry/exit criterion. This avoids chasing breakouts that occur in abnormal volatility conditions and focuses on those crossovers likely to have staying power.
How to Use It in an Example Strategy:
Imagine you are a swing trader looking to identify medium-term trend changes. You apply this indicator to a chart of a popular currency pair or a leading tech stock. Over the past few days, the 50 EMA has been meandering around the weighted average line, both confined within the standard deviation zone.
Bullish Example:
Suddenly, the 50 EMA crosses decisively above the weighted average line while both are still hovering within the volatility zone. This might be your cue: you interpret this crossover as the 50 EMA acknowledging the recent upward shift in price dynamics that the weighted average has highlighted. Since it occurred inside the normal volatility range, it’s less likely to be a head-fake. You place a long position, setting an initial stop just below the lower band to protect against volatility.
If the price continues to rise and the EMA stays above the average, you have confirmation to hold the trade. As the price moves higher, the weighted average may follow, reinforcing your bullish stance.
Bearish Example:
On the flip side, if the 50 EMA crosses below the weighted average line within the zone, it suggests a subtle but meaningful change in trend direction to the downside. You might short the asset, placing your protective stop just above the upper band, expecting that the statistically “normal” level of volatility will contain the price action. If the price does break above those bands later, it’s a sign your trade may not work out as planned.
Other Indicators for Confluence:
To strengthen the reliability of the signals generated by this weighted average zone approach, traders may want to combine it with other technical studies:
Volume Indicators (e.g., Volume Profile, OBV):
Confirm that the trend crossover inside the volatility zone is supported by volume. For instance, an uptrend crossover combined with increasing On-Balance Volume (OBV) or volume spikes on up candles signals stronger buying pressure behind the price action.
Momentum Oscillators (e.g., RSI, Stochastics):
Before taking a crossover signal, check if the RSI is above 50 and rising for bullish entries, or if the Stochastics have turned down from overbought levels for bearish entries. Momentum confirmation can help ensure that the trend change is not just an isolated random event.
Market Structure Tools (e.g., Pivot Points, Swing High/Low Analysis):
Identify if the crossover event coincides with a break of a previous pivot high or low. A bullish crossover inside the zone aligned with a break above a recent swing high adds further strength to your conviction. Conversely, a bearish crossover confirmed by a breakdown below a previous swing low can make a short trade setup more compelling.
Volume-Weighted Average Price (VWAP):
Comparing where the weighted average zone lies relative to VWAP can provide institutional insight. If the bullish crossover happens while the price is also holding above VWAP, it can mean that the average participant in the market is in profit and that the trend is likely supported by strong hands.
This indicator serves as a tool to balance long-term perspective, short-term adaptability, and volatility normalization. It can be a valuable addition to a trader’s toolkit, offering enhanced clarity and precision in detecting meaningful shifts in trend, especially when combined with other technical indicators and robust risk management principles.

Pullback Candle (Bullish & Bearish, No EMA)🔍 Purpose
This indicator detects simple pullback reversal patterns based on price action and swing highs/lows — without any moving average or trend filters.
It highlights:
Bullish pullbacks (potential bounce/long setups)
Bearish pullbacks (potential rejection/short setups)
📈 Bullish Pullback Criteria
Three-bar pattern:
Bar 3: Highest close
Bar 2: Lower close
Bar 1: Even lower close
Current bar closes above previous bar (bullish reversal)
One of the last two candles is the lowest low of the past 6 bars (swing low)
📍 Result: A small green cross is plotted below the bar, and the bar is colored green.
📉 Bearish Pullback Criteria
Three-bar pattern:
Bar 3: Lowest close
Bar 2: Higher close
Bar 1: Even higher close
Current bar closes below previous bar (bearish reversal)
One of the last two candles is the highest high of the past 10 bars (swing high)
📍 Result: A small red cross is plotted above the bar, and the bar is colored red.
🔔 Alerts
One alert condition each for bullish and bearish pullback detection.
Can be used to trigger TradingView alerts.
🛠️ Customization
No inputs — fully automated logic
Clean, minimal, and fast
Can be extended with labels, alert sounds, or signals

Candlestick High/Low Labels📌 Indicator Name:
Candlestick High/Low Labels
🧠 Author:
Precious Life Dynamics (@Precious_Life)
📋 Description:
The Candlestick High/Low Labels indicator highlights recent price extremes by placing labels above highs and below lows of previous candles.
Additionally, it displays a live OHLCV dashboard in the bottom-right corner, offering a quick overview of recent market data.
This tool is especially useful for:
Identifying support/resistance levels
Tracking candle behavior
Visualizing volume trends in context
⚙️ How It Works:
🔸 High/Low Labels:
Each of the most recent candles (based on Candle Lookback) is annotated as follows:
🔹 Red label above each candle’s high
🔹 Green label below each candle’s low
🔹 Price values are rounded (no decimals)
🔹 Labels are dynamically updated; old ones are removed
🔹 Label visibility can be toggled via the Show Labels input
🔸 OHLCV Dashboard:
A real-time data table appears in the bottom-right corner of the chart.
It displays the last N candles (based on Dashboard Lookback) with the following fields:
🔹 Candle Number (1 = most recent)
🔹 Open, High, Low, Close
🔹 Volume
🔹 Values are rounded for readability
🔹 White background with black text ensures high visual clarity
🔧 Customizable Inputs:
✅ Candle Lookback → Number of candles to label (default: 10)
✅ Show Labels → Toggle High/Low label display on/off
✅ Dashboard Lookback → Number of candles shown in the OHLCV table (default: 10)
🎯 Use Cases:
🔹 Identify recent price extremes and reaction zones
🔹 Spot dynamic support and resistance levels
🔹 Observe how candles behave at swing highs/lows
🔹 Monitor volume activity in relation to price
🔹 Use as a clean visual tool for scalping and intraday trading
📝 Notes:
🔹 This indicator is purely visual – it does not generate trade signals
🔹 Best suited for traders who value clear, real-time price structure feedback

TrendSync Pro (SMC)📊 TrendSync Pro (SMC) – Advanced Trend-Following Strategy with HTF Alignment
Created by Shubham Singh
🔍 Strategy Overview
TrendSync Pro (SMC) is a precision-based smart trend-following strategy inspired by Smart Money Concepts (SMC). It combines: Real-time pivot-based trendline detection
Higher Time Frame (HTF) filtering to align trades with dominant trend
Risk management via adjustable Stop Loss (SL) and Take Profit (TP)
Directional control — trade only bullish, bearish, or both setups
Realistic backtesting using commissions and slippage
Pre-optimized profiles for scalpers, intraday, swing, and long-term traders
🧠 How It Works:
🔧 Strategy Settings Image:
beeimg.com
The strategy dynamically identifies trend direction by using swing high/low pivots. When a new pivot forms: It draws a trendline from the last significant pivot
Detects whether the trend is up (based on pivot lows) or down (based on pivot highs)
Waits for price to break above/below the trendline
Confirms with HTF price direction (HTF close > previous HTF close = bullish)
Only then it triggers a long or short trade
It exits either at TP, SL, or a manual trendline break
🛠️ Adjustable Parameters:
Trend Period: Length for pivot detection (affects sensitivity of trendlines)
HTF Timeframe: Aligns lower timeframe entries with higher timeframe direction
SL% and TP%: Customize your risk-reward profile
Commission & Slippage: Make backtests more realistic
Trade Direction: Choose to trade: Long only, Short only, or Both
🎛️ Trade Direction Control:
In settings, you can choose: Bullish Only: Executes only long entries
Bearish Only: Executes only short entries
Both: Executes both long and short entries when conditions are met
This allows you to align trades with your own market bias or external analysis.
📈 Entry Logic: Long Entry:
• Price crosses above trendline
• HTF is bullish (HTF close > previous close)
• Latest pivot is a low (trend is considered up)
Short Entry:
• Price crosses below trendline
• HTF is bearish (HTF close < previous close)
• Latest pivot is a high (trend is considered down)
📉 Exit Logic: Hit Take Profit or Stop Loss
Manual trendline invalidation: If price crosses opposite of the trend direction
⏰ Best Timeframes & Recommended Settings:
Scalping (1m to 5m):
HTF = 15m | Trend Period = 7
SL = 0.5% | TP = 1% to 2%
Intraday (15m to 30m):
HTF = 1H | Trend Period = 10–14
SL = 0.75% | TP = 2% to 3%
6 Hour Trading (30m to 1H):
HTF = 4H | Trend Period = 20
SL = 1% | TP = 4% to 6%
Swing Trading (4H to 1D):
HTF = 1D | Trend Period = 35
SL = 2% | TP = 8% to 12%
Long-Term Investing (1D+):
HTF = 1W | Trend Period = 50
SL = 3% | TP = 15%+
Note: These are recommended base settings. Adjust based on volatility, asset class, or personal trading style.
📸 Testing Note:
beeimg.com
TradingView limits test length to 20k bars (~40 trades on smaller timeframes). To show long-term results: Test on higher timeframes (e.g., 1H, 4H, 1D)
Share images of backtest result in description
Host longer test result screenshots on Imgur or any public drive
📍 Asset Behavior Insight:
This strategy works on multiple assets, including BTC, ETH, etc.
Performance varies by trend strength:
Sometimes BTC performs better than ETH
Other times ETH gives better results
That’s normal as both assets follow different volatility and trend behavior
It’s a trend-following setup. Longer and clearer the trend → better the results.
✅ Best Practices: Avoid ranging markets
Use proper SL/TP for each timeframe
Use directional filter if you already have a directional bias
Always forward test before going live
⚠️ Trading Disclaimer:
This script is for educational and backtesting purposes only. Trading involves risk. Always use risk management and never invest more than you can afford to lose.

Filter-Out Weak Pivot highs/lows, Swing highs/lows: MethodJust a simple indicator for refining the standard method of finding Pivot highs & Lows; Allowing user to filter-out weak/flat/rounded Pivot highs/lows
-Aim of this is to get pivot highs & pivot lows coded to print more in line with what the eye would naturally be drawn to as an obvious pivot high/low.
-This uses local moving average around the pivot high/low together with user-input ATR multiple, to create a condition for filtering out lacklustre pivot highs/lows.
-Thought i'd publish this separately as a tool that other coders might find useful.
//inputs//
~adjust looback/lookforward for Pivot highs/lows
~adjust 'spikiness' index to filter out less impressive pivot highs/lows (higher number = more selective)
Market Structure MA Based BOS [liwei666]
🎲 Overview
🎯 This BOS(Break Of Structure) indicator build based on different MA such as EMA/RMA/HMA, it's usually earlier than pivothigh() method
when trend beginning, customer your BOS with 2 parameters now.
🎲 Indicator design logic
🎯 The logic is simple and code looks complex, I‘ll explain core logic but not code details.
1. use close-in EMA's highest/lowest value mark as SWING High/Low when EMA crossover/under,
not use func ta.pivothigh()/ta.pivotlow()
2. once price reaching EMA’s SWING High/Low, draw a line link High/Low to current bar, labled as BOS
3. find regular pattern benefit your trading.
🎲 Settings
🎯 there are 4 input properties in script, 2 properties are meaningful in 'GRP1' another 2 are display config in 'GRP2'.
GRP1
MA_Type: MA type you can choose(EMA/RMA/SMA/HMA), default is 'HMA'.
short_ma_len: MA length of your current timeframe on chart
GRP2
show_short_zz: Show short_ma Zigzag
show_ma_cross_signal: Show ma_cross_signal
🎲 Usage
🎯 BOS signal usually worked fine in high volatility market, low volatility is meaningless.
🎯 We can see that it performs well in trending market of different symbols, and BOS is an opportunity to add positions
BINANCE:BTCUSDTPERP
BINANCE:ETHUSDTPERP
🎯 MA Based signal is earlier than pivothigh()/pivotlow() method when trend beginning. it means higher profit-loss rate.
🎯 any questions or suggestion please comment below.
Additionally, I plan to publish 20 profitable strategies in 2023; indicatior not one of them,
let‘s witness it together!
Hope this indicator will be useful for you :)
enjoy! 🚀🚀🚀

Trading BehnamI've read around here various definitions for engulfs along the lines of "an engulf consumes all orders at a level to allow price to easily pass through it." . That doesn't make much sense to me, if the guys with billions of dollars want to break a level, they will break it and price will run off very often. We've seen it time and time again, they don't need to engulf levels to give us a nice opportunity to get into the trade with them, if they want to blast through a level, they will do so and price will run off. If they want an opportunity to accumulate more orders before price runs away, then it doesn't make sense to engulf the level, better to let price bounce from that level and then fill more orders, if the level breaks then they have to deliberately stop the market running away and move it back to the pre-engulf area as the market momentum would naturally make it run off after an engulf. Other ideas about it being a secret signal between the institutions don't make sense to me either. To be honest, I think any secret signals between competing institutions come in the form of them in a heavily encrypted chatroom telling each other what to do. This collusion has been reported on previously as traders align their activities at important moments.
So I think we can all agree something along the lines of:
Fakeout:
Fakeout is an engulf of an obvious swing high/low in order to stop out traders and induce breakout traders to trade in the wrong direction, thus generating liquidity for the move in the opposite direction.
What's not so clear is the definition of the engulf, I'd like to try to give some ideas on the purpose of the engulf and it's definition and see what others think.
Engulf:
An engulf is the consumption of orders at an important level, not necessarily a swing/high low but an area where we expect to see supply or demand. Taking out of the orders tells us that the supply or demand which was or should have been present is now not present and tells us the intent direction of the market. If price runs off as is often the case, this is not tradeable and is effectively just a "breakout", although breakouts are usually considered to be breaks of swing high and lows which are obvious to the average trader. For an engulf to be tradeable there must be a retrace following the engulf back in the original direction. This adds confusion as it initially resembles a fakeout. So the question is, why does price retrace after the engulf? If an engulf to the short side is a genuine engulf and not a fakeout to generate long liquidity, why does it not travel immediately south if market momentum is ultimately south.
A small pocket of demand beneath the engulfed level may make it retrace north as price moves between areas of liquidity, this pocket of demand may give price enough momentum to make it back up to the supply which broke the demand level if key market participants do not favour an immediate market drop.
Alternatively key market participants may step in and drive the market back upwards.
Price moving north back to supply after the engulf may occur or be favourable for various reasons:
1) We often talk about FO generating liquidity because of breakout trading, but an engulf can also generate liquidity from breakout traders. Short breakout traders would place their stop losses a small distance above the engulf (breakout). If key players absorb this selling or allow a demand level to push price back up, they can run price back up to supply taking out the stops of the breakout short traders and make quick profit and/or generate more liquidity for their own shorts.
2) To confuse traders, the ITs don't want the puzzle that is Forex to be easy to solve, if price never retraced after an engulf then engulfs of all levels would be FOs. Price would either break and immediately runoff or it would turn and runoff in the other direction. In order to keep people confused about whether price is faking out or breaking out, sometimes price should whipsaw by breaking out, briefly faking out and then continuing in the direction of the breakout. This whipsaw pattern is to us a tradeable engulf.
3) Market momentum may be mixed, key players are indecisive or inactive or the market is behaving erratically.
4) As previously mentioned there may be a small pocket of supply/demand just past the engulf which is causing a reaction. This could also be viewed as a FO on a different timeframe. If the market engulfs an H1 demand level, then retraces for 30 mins upwards to supply, this engulf would be a valid and very profitable FO for an M1 trader looking to get long.

CHOCH + FVG Signals [30m Optimized]CHOCH + FVG Signals
🎯 What It Does:
This script automatically scans your chart for high-probability Smart Money Concepts (SMC) setups based on two key institutional trading principles:
Change of Character (CHOCH) – A shift in market structure signaling potential reversal
Fair Value Gap (FVG) – An imbalance zone where price moved too fast, often acting as support/resistance
When both conditions align, the script plots clear Buy (▲) and Sell (▼) signals directly on your chart — ideal for intraday trading on the 30-minute timeframe (but works on any timeframe).
✅ Key Features:
🔹 Visual Fair Value Gaps
Green shaded zones = Bullish FVGs (potential support)
Red shaded zones = Bearish FVGs (potential resistance)
Toggle on/off in settings
🔹 Smart CHOCH Detection
Detects breaks of recent swing highs/lows with proper context
Avoids false signals by confirming prior price structure
🔹 Clear Trade Signals
Green ▲ below bar = Buy signal (Bullish CHOCH + FVG confluence)
Red ▼ above bar = Sell signal (Bearish CHOCH + FVG confluence)
🔹 Customizable Filters
Option to require FVG for a signal (recommended for higher accuracy)
Adjust sensitivity via swing detection settings (default optimized for 30m)
🔹 Alert-Ready
Built-in alert conditions for instant notifications on TradingView mobile/desktop
⚙️ How to Use:
Apply to a 30-minute chart (e.g., EURUSD, Gold, NAS100, BTC)
Wait for at least 50–100 bars to load (so swing points appear)
Look for:
A green triangle (▲) → consider long entry near FVG support
A red triangle (▼) → consider short entry near FVG resistance
Confirm with price action: Wait for a strong candle close or rejection at the FVG zone
Use stop-loss below/above the FVG and target recent liquidity pools
💡 Pro Tip: Best used during high-volume sessions (e.g., London Open 7–10 AM UTC, NY Open 12:30–3:30 PM UTC).
🛠️ Settings (Inputs):
Show Fair Value Gaps
✅ Enabled
Visualize FVG zones
Max FVG History
100 bars
Prevent chart clutter
Require FVG for Signal?
✅ Enabled
Higher-quality setups (disable to test CHOCH-only)
⚠️ Important Notes:
This is a signal generator, not financial advice. Always manage risk.
Works best in trending or breaking markets — avoid during low-volatility ranges.
FVGs may get filled (tested) before price continues — patience improves results.
Backtest on historical data before live trading.
📣 Ideal For:
Retail traders learning Smart Money Concepts (SMC)
Price action traders seeking institutional-level confluence
Intraday scalpers & swing traders on 30m–1H timeframes

BOS mark-out (by Lumiere)Advanced BOS Detection with Strict Swing Confirmation
This indicator implements BOS detection with several unique features:
🔹 Dual-Candle Swing Validation - Unlike most BOS indicators that use single candle swings, this uses a two-candle confirmation for swing highs/lows, analyzing both the candle wicks and body transitions.
🔹 Directional Lock System - Implements a state machine that prevents duplicate signals until an opposite-direction BOS occurs, reducing noise.
🔹 Precision Wick Analysis - Compares wicks between the reversal candle and confirmation candle to identify the true swing point.
🔹 Real-Time Update & Live Market Adaptation – The indicator continuously monitors price action and instantly updates BOS signals as new candles form, ensuring you never miss a BOS.
How It Differs From Other BOS Indicators:
Most public BOS indicators use simple HH/HL or LH/LL detection.
Many don't implement the directional locking mechanism.
Few use the two-candle wick comparison approach.
Wick-Based Precision uses the extreme wicks of two candles (not just the body).
Strict Confirmation requires a close beyond the swing point (no "wick breaks" counted).
Usage Examples:
🟦 Bullish BOS:
A green candle closes, followed by a red candle. This will be the new high, and if the next candle closes above the highest wick of those two, it will be a BOS (only if we had a bearish BOS before)
🟥 Bearish BOS:
A red candle closes, followed by a green candle. This will be the new low, and if the next candle closes below the lowest wick of those two, it will be a BOS (only if we had a Bullish BOS before)
